- Posted on
- • Other Electronics
Fun With The Sun - The Solar Monitor 5 Million! (Experiment) Pt.1
- Author
-
-
- User
- Mr Blinky
- Posts by this author
- Posts by this author
-
I have been meaning to write this up for a couple of weeks now, and I finally do it. This is an experiment I am conducting (very loosely at present) that came about from leaving my CAJOE RadiationD-v1.1 with J305by on my window sill for a week and noticed a strange pattern with the 'excess' counts. They were stronger in the morning than in the afternoon, even to the point they were stronger than in direct sunlight. I mentioned this to a couple of members here and we all agree that it is strange, and that we all expected there to be more counts in direct sunlight than in the morning with indirect sunlight. I find this confusing and there has to be a reason, so this experiment is aimed at trying to figure out why. I don't know if it will work or not but I do now have enough data to show that direct sunlight doesn't seem to affect the tube more than indirect, morning sun.
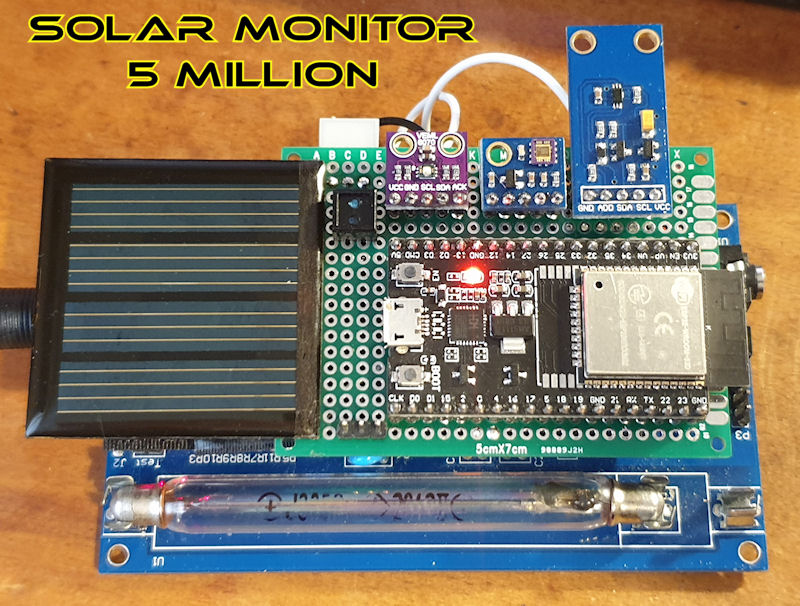
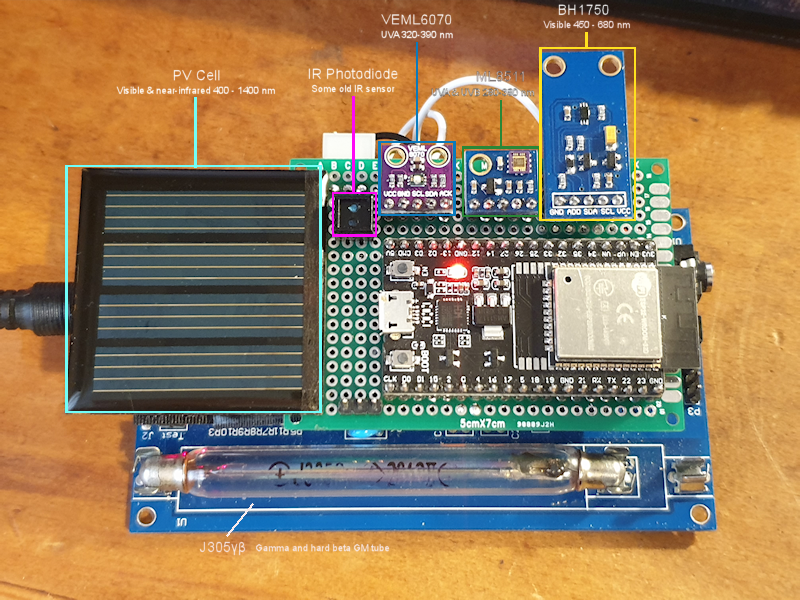
I had some light sensors and bits and bobs, so cobbled them together, hooked up to an ESP32 and started logging the data. And they grew into the 'Solar Monitor 5 Million!' 😊 (as pictured above.)
So, what does it do? It logs CPM from the RadiationD-v1.1 to here (station SimoTester3 ) and then there are 5 other sensors that log to my web server and Blynk. Blynk is so I can view on my phone. The array consists of the following sensors:
- VEML6070 - UVA 320-390 nm
- ML8511 - UVA & UVB 280-380 nm
- BH1750 - Visible 450 - 680 nm
- PV Cell - Visible & near-infrared 400 - 1400 nm
- Some old IR sensor (Photodiode (no idea on spec))
- J305yb GM tube (and counter)
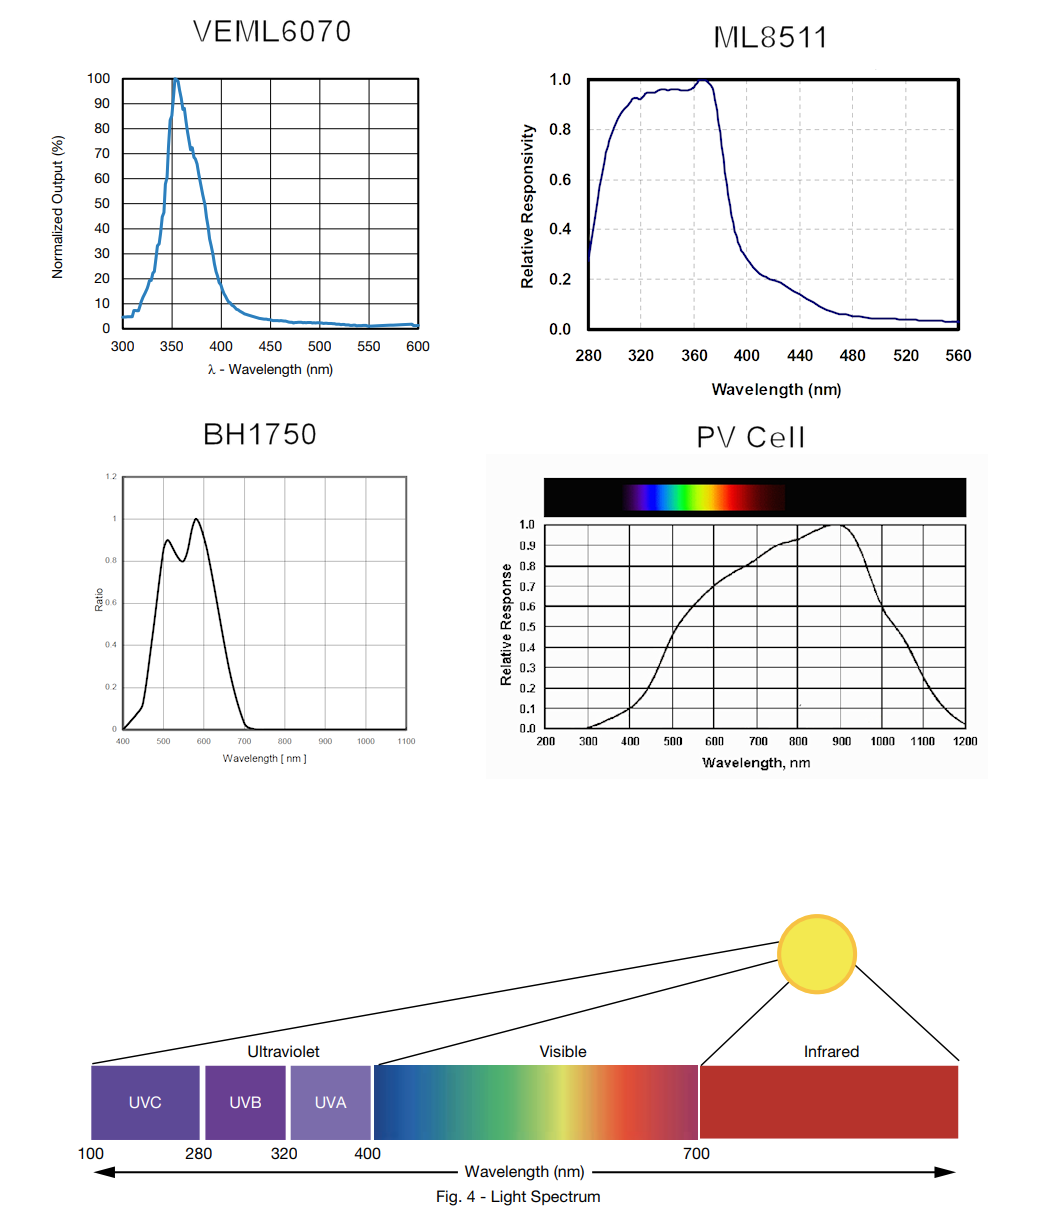
The image below shows the spectral range of the 4 main sensors. I don't have any data for the old IR sensor, I just fitted that to see what it would do, and also no light data for the J305by, as there isn't any. The PV cell frequency range was obtained by reading the specs of many different ones and then just approximating the start and end of the range. The spectrum shown for the PV cell is a generic spectrum that generally covers the range of most PV cells.
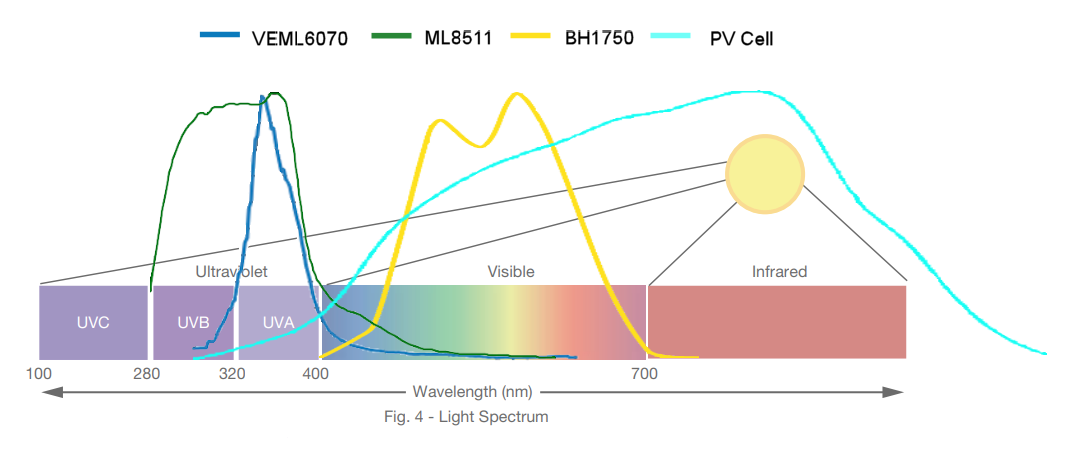
This image shows each sensor's spectrum over the visible light spectrum.
And this image shows the placement of each sensor on the array.
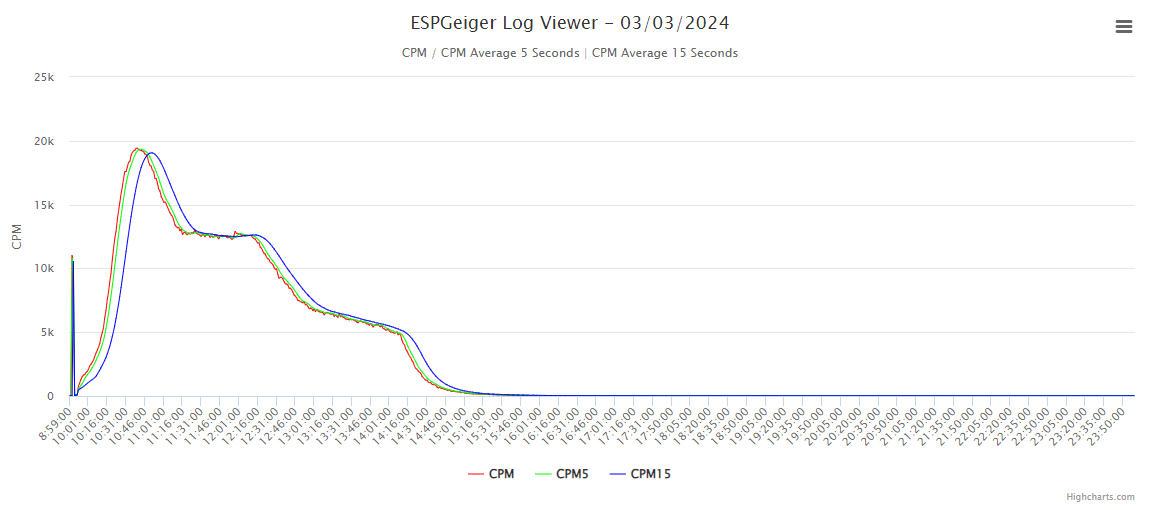
These all together cover quite a large portion of the light spectrum, from 280nm UVB to ~1400nm NIR (near-infrared). My theory was that a certain spectrum of light was affecting the tube, and that spectrum was more prevalent in the mornings. I'm not so sure now and I am starting to wonder if the tube gets less sensitive to daylight the longer it is in daylight. When I first put the J305yb on my window sill for the first time it went crazy. Thousands of counts per minute and kept climbing. I did find this odd that it didn't just peak and then drop off as the day went on, or that for the first day it didn't seem to go up and down with the strength of daylight. It seemed to keep climbing for well over an hour, then started to come down. It's also strange that it has a downward step pattern. This could be the amount of daylight on that day. I don't have any other data from that early on in the experiment. The results of the first day is the graph right below. It's kind of crazy.
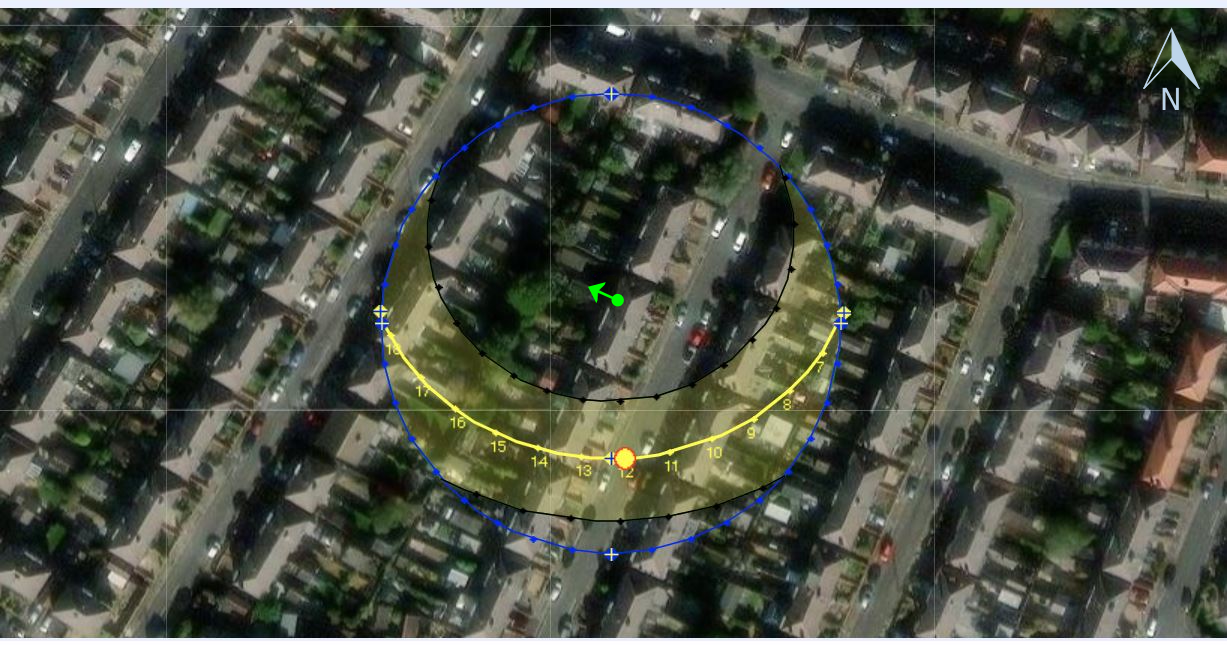
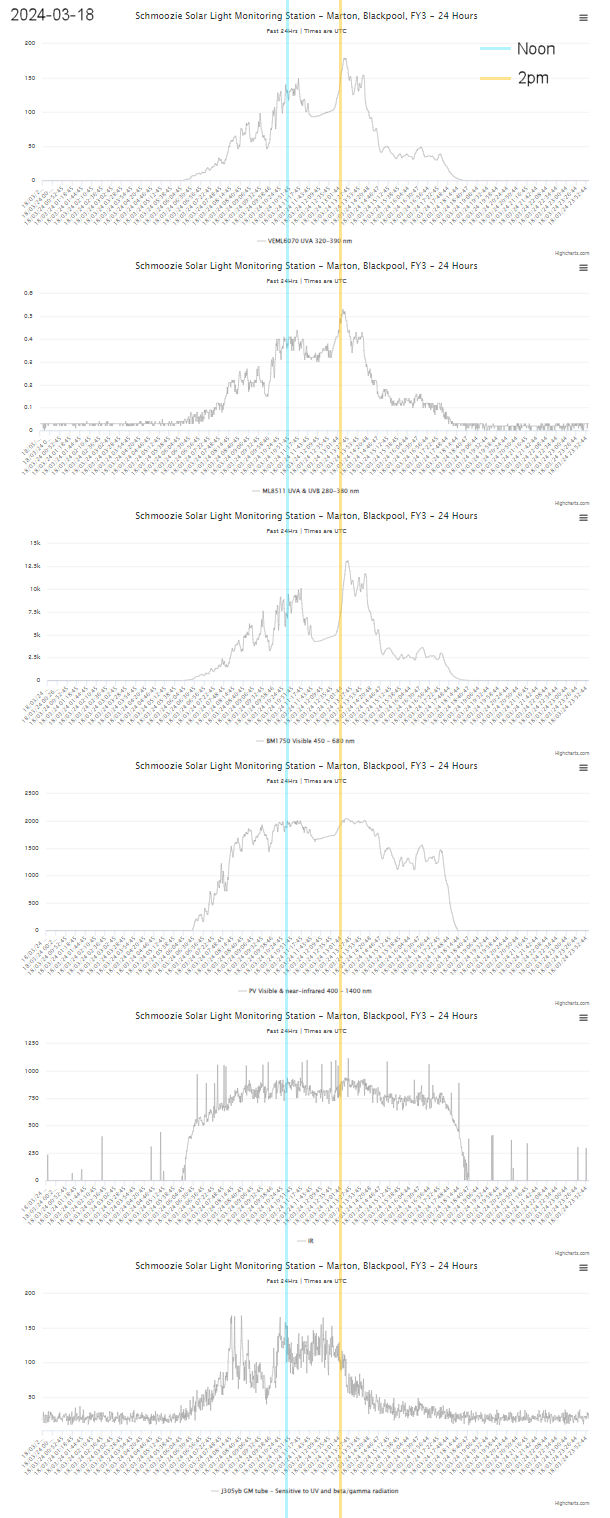
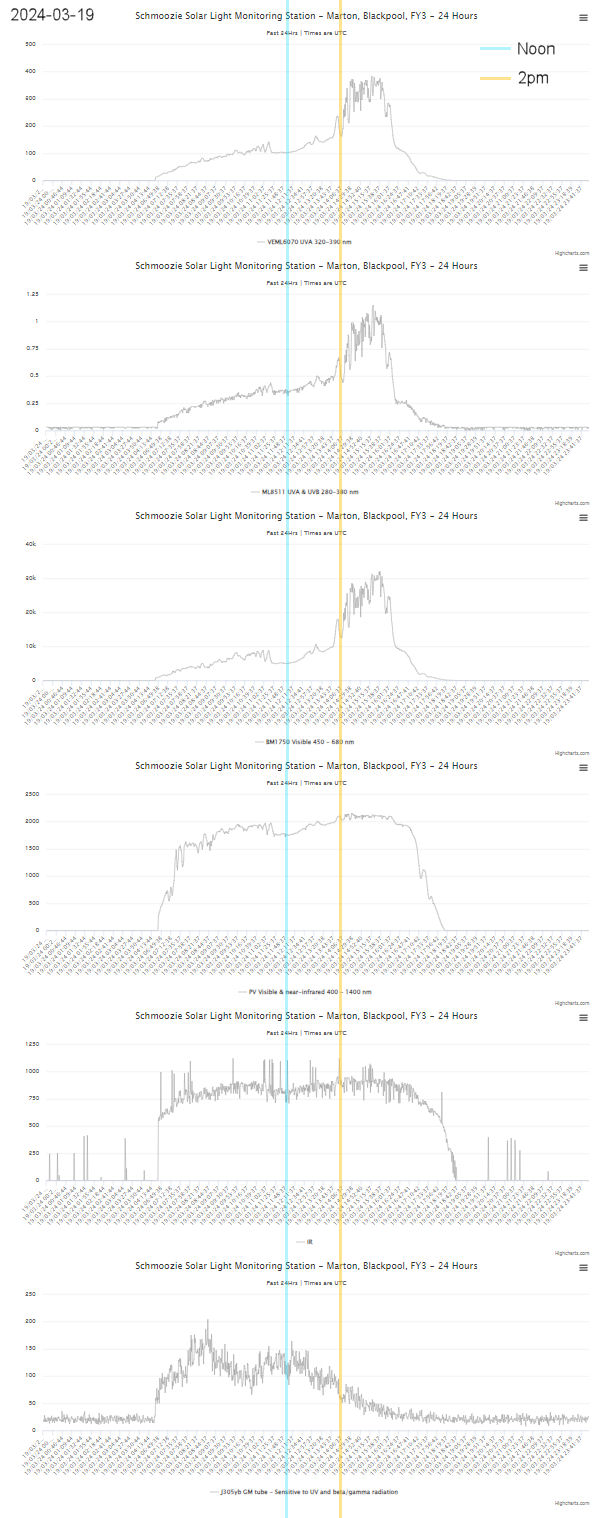
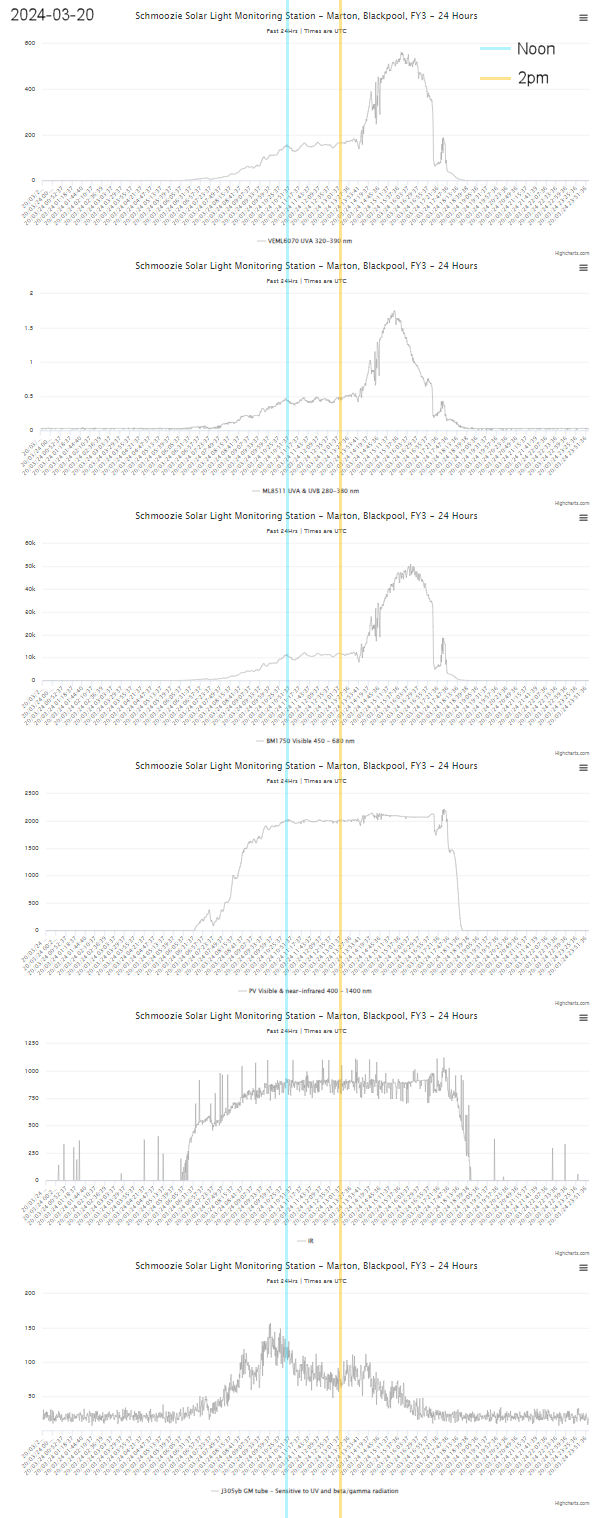
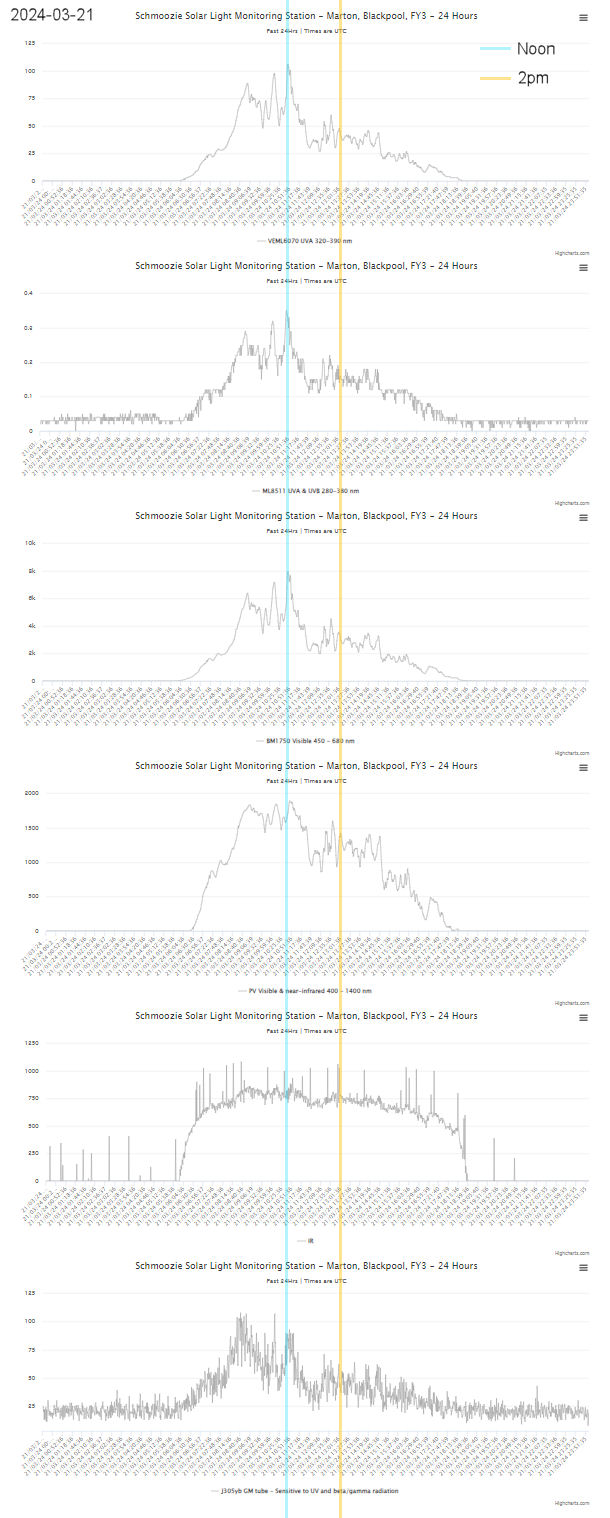
The following image shows the way the array is facing (WNW) and the relation of my house. The sensor array is sat on the 1st floor window sill in my office. It is about 45 degrees vertical and points in the direction shown on the image. I have also plotted the sun's position and you can see that just after 14:00 the sun comes around to the back of the house and only at that point is direct sunlight possible. That image was created a couple of weeks ago so the time has shifted more to 14:30-14:45. So any readings before 14:00 (I'll use this time as the data graphs (attached to the bottom of this post as they are quite lengthy) are in the same time frame) are only reflected light and not direct sunlight, but as you will see in the data graphs the J305yb GM tube is quite different to the light sensors. It should be noted that the array is located inside, behind a double-glazed window.
If you scroll down and examine the data graphs it can clearly be shown the J305yb is certainly not in sync with the strength of the sun. So what is causing the discrepancy? Is it a certain frequency/band of light that affects the GM tube more? Does daylight emit more of a certain spectrum at different times of day? So far all this experiment has done is given me more unanswered questions, which isn't a bad thing if I can answer some of them. Maybe that will come in time. Another thing I have learned so far is that this will probably be a long experiment over many months. I have also learned that I don't have the full picture and that it would be super handy to have the actual light spectrum from a colour spectrometer to compare at different times of day and see if any patterns develop over time. And I do have a colour spectrometer running on Theremino, but there seems to be no way I can automate colour spectrum captures with Theremino, which is a big shame. I could maybe use some software to screen grab a portion of the screen showing the colour spectrum, but in doing so would put my PC mainly out of commission as I use it all the time and having something on the screen being captured 24/7 isn't ideal.
So after some digging I found there was a colour sensing IC (TCS230 or TCS3200) that may do the job, so I bought one. Then I discovered there is a specific IC that will capture 11 bands of light (AS7341), so I bought one of those also. There are 7 or 8 bands in the visible range and also NIR and clear. Clear is all the light, unfiltered.
So what next? I need to get the new sensor (AS7341) added to the array and get that logging the light spectrum every few minutes. I may be able to log it every minute as with the other sensors, although reading the data and comparing with the other sensors will be tricky as you can't show it in a 2-dimensional graph. I could with a 3-dimensional graph, but I have no way of generating one... Yet.... For now though logging the data and I can work out displaying it later. I also need to really do some research into sun light, times of day and a whole load of other stuff. I need to try and calibrate some of the sensors if I can. The old IR sensor will be getting ditched at some point and I want to change it for a better one, preferably one that I can get the data sheet for that will show it's sensing range. I have a couple of old vintage ones somewhere. They look expensive with a nice glass lens on them, if I remember correctly. I think they came from a really old hard drive, either speed sensing or stepper motor end stops. I will dig them out and see if I can get a datasheet for them.
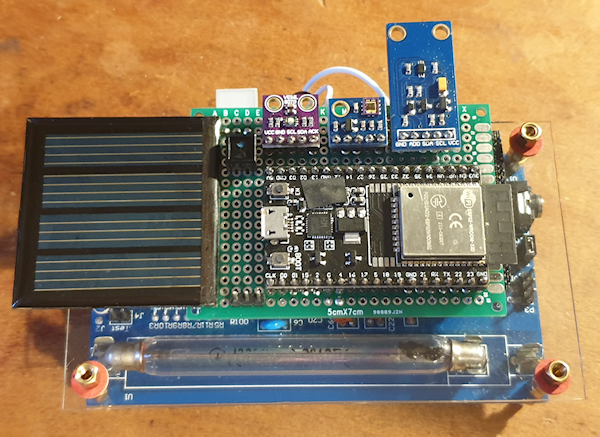
Last night I decided to mount the clear plastic cover to the CAJOE RadiationD-v1.1 and found today that the J305by GM tube had not registered hardly any additional counts except background. That tells me the plastic (acrylic/perspex/whatever it is) is stopping or massively reducing the photon induced counts, so I need to alter that a bit so the light shines right onto the tube. Maybe that is a trait of the light sensitive tubes - that they require light to hit the glass wall of the tube. But I have it behind glass, so why would clear plastic make a difference, but glass windows don't? Again, more questions rather than answers. The image below shows the array mounted to the clear plastic now, and the clear plastic is covering the J305by tube. I think I'll keep it running like this for a couple of days and then cut some of the plastic away to allow the light to hit the tube directly. A couple of issues that have shown up are the BH1705 (visible light sensor) does max out with direct sunlight, the PV cell also did a lot, but I tweaked that last night so will see in time. The old IR sensor seems to suffer with some spikes at random intervals. I'm not sure if this is interference of some kind, or something akin to the ESP32 and firmware and maybe caused by reading the other sensors, or something like that. Again, more questions. But that sensor is going to be swapped out with a different one at some point.
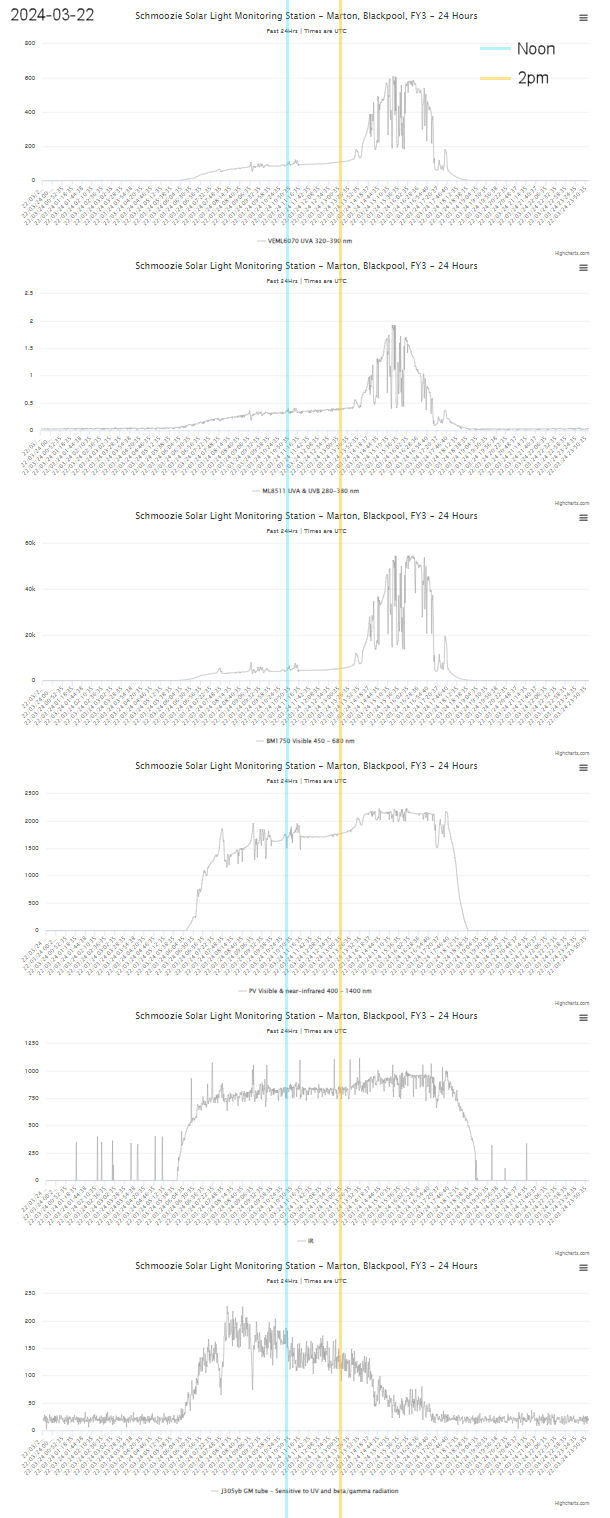
And finally the actual data itself. The graphs are from 5 consecutive days. I have marked lines denoting 12:00 and 14:00. 12:00 is/used to eb generally considered to be the lightest part of the day and 14:00 is when the sun comes around to the rear of the house and then the sensor array gets direct sunlight. Of course this is all dependant on the weather and clouds, and lately it has been pretty miserable weather here. From the data graphs we can clearly see that on the 19th, 20th and 22nd the J530by tube peaked and was dropping as the other light sensors started to pick up. Very, very strange. My apologies for making this post so long, but I'm struggling to find a better way of showing the data in a more condensed fashion.
Archived from radmon.org - originally posted 10/04/2024
Add Comment
This policy contains information about your privacy. By posting, you are declaring that you understand this policy:
- Your name, rating, website address, town, country, state and comment will be publicly displayed if entered.
- Aside from the data entered into these form fields, other stored data about your comment will include:
- Your IP address (not displayed)
- The time/date of your submission (displayed)
- Your email address will not be shared. It is collected for only two reasons:
- Administrative purposes, should a need to contact you arise.
- To inform you of new comments, should you subscribe to receive notifications.
- A cookie may be set on your computer. This is used to remember your inputs. It will expire by itself.
This policy is subject to change at any time and without notice.
These terms and conditions contain rules about posting comments. By submitting a comment, you agree with these rules:
- Although the administrator will attempt to moderate comments, not all comments can be moderated at all times.
- You acknowledge that all comments express the opinions of the original author and not those of the administrator.
- You will not post material which is knowingly false, obscene, hateful, threatening, harassing or invasive of privacy.
- The administrator has the right to edit, move or remove any comment for any reason and without notice.
Failure to comply with these rules may result in being banned from submitting further comments.
These terms and conditions are subject to change at any time and without notice.
Comments